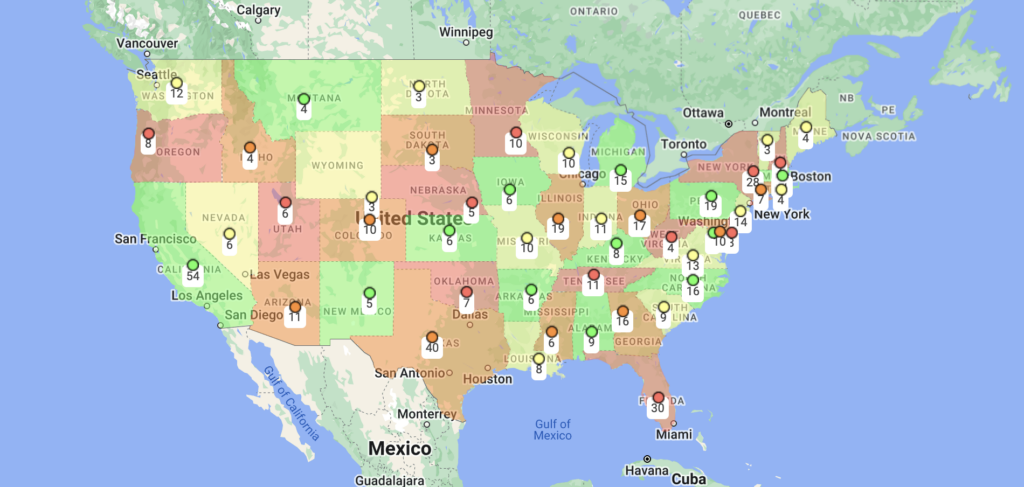
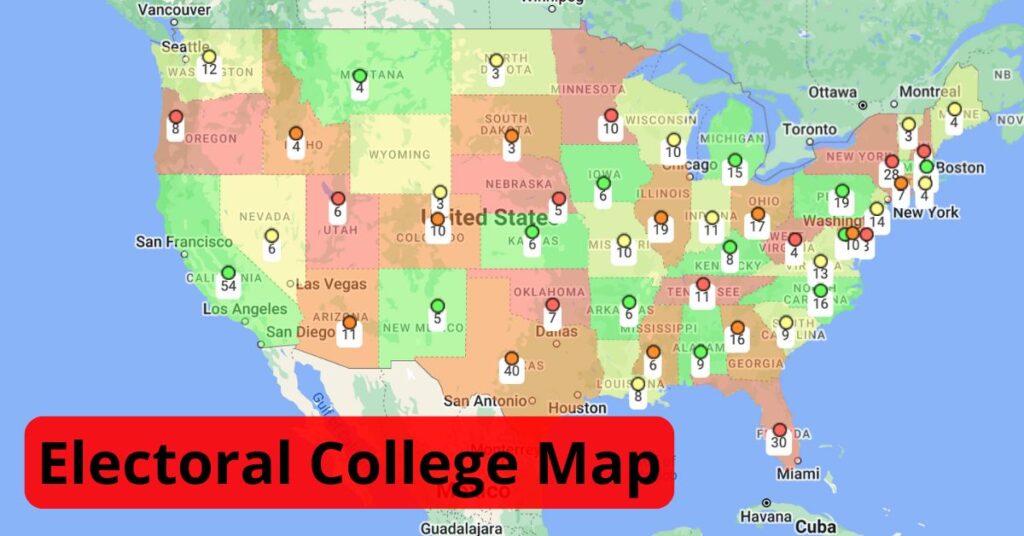
Election season is in full swing, and voters in the United States are eagerly awaiting November 5. The presidential election in the United States is a unique and complex process that involves the Electoral College. It’s part of a mechanism established by the Constitution allowing for the indirect election of the president and vice president. Therefore, for engaged citizens and voters, it is crucial to understand the Electoral College map and how electoral votes by state are allocated.
This guide delves into the nuts and bolts of the Electoral College, offering clarity around how the political system operates. Read to the end to check out our map of electoral votes by state.
What is the Electoral College?
The Electoral College is the institution that officially elects the President and Vice President of the United States. It consists of electors, or representatives appointed by each state to vote for the president and vice president. The total number of electors equals the number of members in the U.S. Congress, which is currently 538. Correspondingly, this number includes 535 electors from the states (reflecting the number of members in the House of Representatives and the Senate) and 3 from the District of Columbia.
The number of electors (538) is a direct result of the 2020 census. Accordingly, this number is effective for both the 2024 and 2028 presidential elections. In order for a candidate to win the presidential election, they need to win 270 of the Electoral College’s votes.
Electoral Votes by State
Each state has a number of electors equal to its total number of representatives and senators in Congress. This process ensures that both population and equal state representation are factored into the election outcome. This distribution means states like California, with a larger population, have more electoral votes (54), while less populous states like Wyoming have the minimum of three electoral votes.
The number of electoral votes by state is significant. Presidential campaigns strategize extensively on how to win the electoral vote by focusing their efforts on states that could swing either way, known as battleground or swing states. Additionally, these states can vary in each election cycle and usually play a decisive role in the election outcome.

| State | Votes | State | Votes | State | Votes |
| Alabama | 9 | Kentucky | 8 | North Dakota | 3 |
| Alaska | 3 | Louisiana | 8 | Ohio | 17 |
| Arizona | 11 | Maine | 4 | Oklahoma | 7 |
| Arkansas | 6 | Maryland | 10 | Oregon | 8 |
| California | 54 | Massachusetts | 11 | Pennsylvania | 19 |
| Colorado | 10 | Michigan | 15 | Rhode Island | 4 |
| Connecticut | 7 | Minnesota | 10 | South Carolina | 9 |
| Delaware | 3 | Mississippi | 6 | South Dakota | 3 |
| District of Columbia (Washington D.C.) | 3 | Missouri | 10 | Tennessee | 11 |
| Florida | 30 | Montana | 4 | Texas | 40 |
| Georgia | 16 | Nebraska | 5 | Utah | 6 |
| Hawaii | 4 | Nevada | 6 | Vermont | 3 |
| Idaho | 4 | New Hampshire | 4 | Virginia | 13 |
| Illinois | 19 | New Jersey | 14 | Washington | 12 |
| Indiana | 11 | New Mexico | 5 | West Virginia | 4 |
| Iowa | 6 | New York | 28 | Wisconsin | 10 |
| Kansas | 6 | North Carolina | 16 | Wyoming | 3 |
Interactive Electoral College Map
Check out our interactive map, which showcases the number of electoral votes by state. Click around and discover how many votes each state has for the Electoral College.
