As the climate crisis intensifies, some scientists believe that the frequency of natural disasters, like earthquakes, are increasing. It’s a scary phenomena, underscored by headlines of devastating wildfires in California, an earthquake in Tibet, and category five hurricanes. But despite what seems like an increasingly urgent crisis, natural disasters are not a new phenomena.
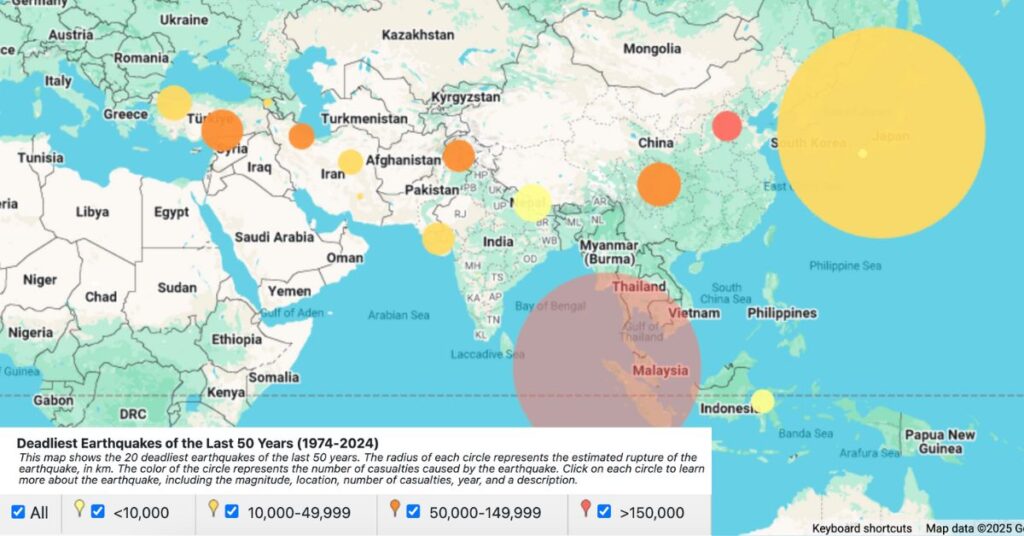
To help us visualize the impact of earthquakes around the world, we built an earthquake map. The map highlights the 20 deadliest earthquakes of the last 50 years, the majority of which occurred around the circum-Pacific seismic belt, or “Ring of Fire.” According to the U.S. Geological Survey (USGS), this region is where over 80 percent of Earth’s largest earthquakes take place.
Interactive Earthquake Map
This map was created using ZeeMaps.
On the map, the radius of each circle represents the estimated rupture of the earthquake in kilometers. You can see some stand out earthquakes with a huge impact include the 2004 Indian Ocean Earthquake and Tsunami. The deadliest earthquake in modern history, the 2004 quake had a devastating 280,000 casualties. The 2011 Tōhoku Earthquake and Tsunami off the coast of Honshu, Japan, also had a huge radius, but far fewer casualties (under 20,000) due to location.
The color of the circle on the map represents the number of casualties caused by the earthquake. The red circles denote earthquakes with over 150,000 casualties. Orange circles show those with between 50,000 and 149,999 deaths, while yellow circles represent events with between 10,000 and 49,999 casualties, and light yellow circles are for quakes with under 10,000 deaths.
You can interact with the map by clicking on each circle to learn more about the earthquake, including the date of event, magnitude, location, number of casualties, and a brief description.
20 Deadliest Earthquakes Since 1974
| Earthquake | Magnitude | Est. Rupture (km) | Location | Casualties |
| 2004 Indian Ocean Earthquake and Tsunami | 9.3 | 1,000 | Sumatra, Indonesia | 280,000 |
| 1976 Tangshan Earthquake | 7.6 | 126 | Hebei, China | 242,769 |
| 2010 Haiti Earthquake | 7.0 | 44 | Port-au-Prince, Haiti | 160,000 |
| 2008 Sichuan Earthquake | 7.9 | 200 | Sichuan, China | 87,587 |
| 2005 Kashmir Earthquake | 7.6 | 141 | Muzaffarabad, Pakistan | 86,000 |
| 2023 Turkey–Syria Earthquake | 7.8 | 177 | Pazarcık, Kahramanmaraş Province, Turkey | 53,000 |
| 1990 Manjil-Rudbar Earthquake | 7.4 | 112 | Rudbar, Iran | 50,000 |
| 2003 Bam Earthquake | 6.6 | 28 | Bam, Iran | 26,000 |
| 1988 Spitak Earthquake | 6.8 | 35 | Spitak, Armenia | 25,000 |
| 1978 Tabas Earthquake | 7.4 | 112 | Tabas, Iran | 25,000 |
| 2001 Bhuj Earthquake | 7.6 | 158 | Bhachau, Gujarat, India | 20,000 |
| 2011 Tōhoku Earthquake and Tsunami | 9.1 | 891 | Honshu, Japan | 19,759 |
| 1999 Izmit Earthquake | 7.6 | 141 | Izmit, Turkey | 17,000 |
| 1985 Mexico Earthquake | 8.0 | 251 | Michoacán, Mexico | 10,000 |
| 1993 Latur Earthquake | 6.2 | 17 | Killari, India | 9,748 |
| 2015 Nepal Earthquake | 7.8 | 177 | Barpak, Nepal | 8,964 |
| 1995 Great Hanshin Earthquake | 6.9 | 39 | Kobe, Japan | 6,434 |
| 2006 Yogyakarta Earthquake | 6.4 | 22 | Bantul, Indonesia | 5,749 |
| 2018 Palu Earthquake and Tsunami | 7.5 | 126 | Palu, Indonesia | 4,340 |
| 2021 Haiti Earthquake | 7.2 | 56 | Petit-Trou-de-Nippes, Haiti | 2,248 |
Earthquake Map
Create Your Own Map with ZeeMaps
To get started uploading a spreadsheet with radius circle markers of your own, you can do one of two things:
- Select the ‘Additions’ > ‘Add (Upload) Multiple Markers’ menu item on your map, or
- Click the ‘Map My Spreadsheet’ button.
- Upload your file. Along with the file, there is an option to specify what kind of markers you would like to add. Select ‘Circles.’
- The next dialog will give you the option to select your radius column, choose the default radius, and select whether the radius values are in miles or kilometers. Even if you are not using the default radius, and have specified radius values for each of your spreadsheet rows, make sure you check the appropriate box for miles or kilometers.
- Circle markers can have different colors and additional information in them that will be visible once you click on the circle.