How do I map data using Excel spreadsheets?
This video explains how to work with Excel spreadsheets in ZeeMaps:
How do I map data from other spreadsheets?
ZeeMaps provides a flexible and easy way to map data from spreadsheets. You can upload your spreadsheet onto a map, copy a table and paste it into a form in ZeeMaps, or attach a Google Drive spreadsheet to a map.
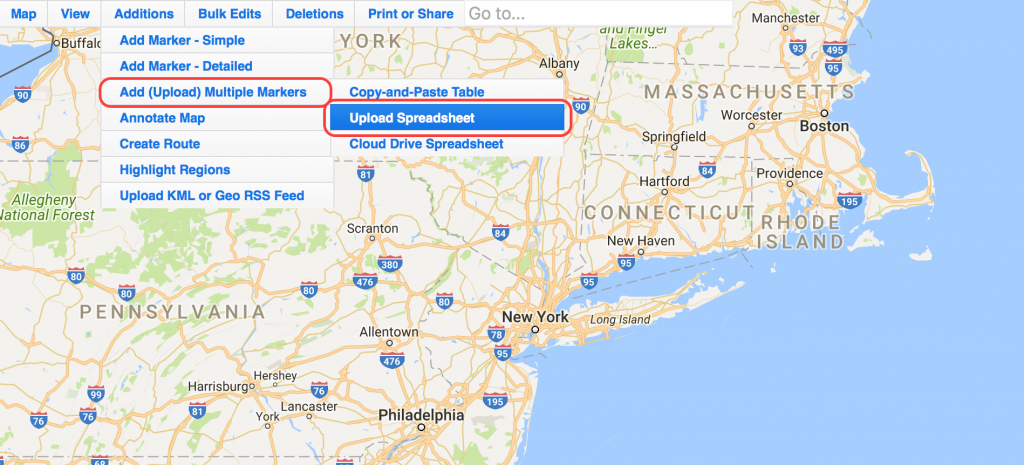
To upload a spreadsheet, select ‘Additions’ from the menu on your map, then ‘Add (Upload) Multiple Markers’. Choose the ‘Upload Spreadsheet’ option. You will get a dialog to browse and select your spreadsheet. If you want, you can also use the ‘Copy-and-Paste Table’ option, or the ‘Cloud Drive Spreadsheet’ option.

Your spreadsheet should have information on it that allows us to determine the location for each row, e.g., a post code, zip code, city, state, etc. Additionally, you can have as many columns as you need. Some columns, such as the ‘Name’ column, will be utilized as one of the “standard” columns, while others will add fields to your markers.
Spreadsheets can also contain street address, city, and state. You can provide latitude, longitude columns as well. The more information you provide, the better we’ll be able to position the pins.
When you upload your spreadsheet, ZeeMaps uses the header row to determine how to use the data in each column. The standard columns names that ZeeMaps uses are described below. As noted above, you do not need to provide all columns. Just enough information for ZeeMaps to locate your entries. For example, you can provide just Name and Postal Code columns, or Name and City columns.
What are the standard columns?
- Address Street: Street location, e.g, 1 Apple Loop. Can also be full location address.
- City: City, e.g, Cupertino
- State: State, e.g, CA or California
- Country: Country, e.g, US, UK, USA
- Post Code: Zip code or postal code, e.g., 95014 or
- Name: Title for the entry. If you do not provide a Name column, your entries will be called “Anonymous”
- Category: Grouping of your entry into different categories, e.g., Gold, Silver, Platinum. Each category will show as a different colored marker. ZeeMaps will also automatically create a legend based on the categories, in the order that they appeared in the spreadsheet. You can re-order them by selecting ‘Map’ then ‘Legend’ from the menu. We support up to 31 categories.
- Latitude: In decimals, e.g., 34.23
- Longitude: In decimals, e.g., -121.05
- Photo URL: If you want, you can specify a photo URL for each entry
- Photo width: Width of the photo element for an entry in pixels
- Photo height: Height in pixels
- YouTube: Specify a YouTube video ID for your entry. (Note that this is just the video ID and not the full URL).
- Video width: Width in pixels
- Video height: Height in pixels
When you upload your Excel spreadsheet – or another spreadsheet – ZeeMaps will ask you to make assignments for the standard columns to your spreadsheet columns. You do not need to have all the columns, just enough information that we can figure out the location for your markers. All columns from your spreadsheet that do not get mapped to a standard column will be used as custom fields of information attached to each marker. You can use these fields later to search on your map.
Can I ignore data?
Yes. If you have more columns in your spreadsheet than you’d like to upload, you can use the ‘Ignore’ tab in the spreadsheet uploader. Just select all the columns that you don’t want to see on the map.