Use highlighted regions and data uploads in ZeeMaps to conduct quick spatial data aggregation. For example, you can analyze data for the different territories you have marked on your map.
Spatial Regions Highlighting
You can highlight areas on your map by zip codes, counties, cities, states or geometrical areas. Such as, circles and rectangles. An area of interest will often comprise of several smaller areas. For example, a sales territory map might divide the country into several regions, each containing multiple states.
The fastest way to highlight large number of US zip code areas or counties on your map is by uploading a spreadsheet with address and color information.
This is far quicker than highlighting regions on your map one at a time. This blog post explains how to do that. When you upload a spreadsheet to highlight zip codes or counties, your spreadsheet can contain additional columns of spatial data that will be taken as “fields” for that zip code or county.
For other areas like US States, or countries, you’ll need to highlight the areas using the Additions -> Highlight Regions menu on your map, and then upload your data using the Additions -> Add (Upload) Multiple markers, separately.
Spatial Data Analysis
Now that you have different territories marked on your map, you can access the spatial aggregate data feature.
As an example, we are using the map of Las Vegas zip codes divided into five colored regions. Each highlighted zip code has population fields that describe populations in 2011 and 2012, and the median income. The map is shown below. Click on any of the highlighted zip code to see the details for that zip code.
When visiting the map on the ZeeMaps site, we select ‘View’ and ‘Aggregate data by region’ from your map menu.
Spatial Data Aggregate Map Menu
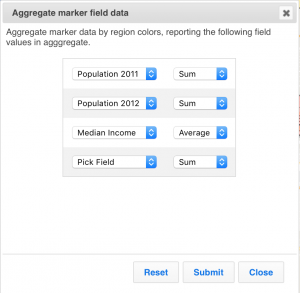
In the resulting dialog, choose your field values and whether you’d like to see results presented as sum, average or count.
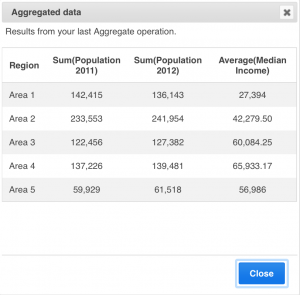
Hit ‘Submit’ to see your aggregate data results that will give you the sum of populations for 2011 and 2012, and the average of the median income in each of the five colored regions that we have defined on the map.
Aggregated spatial data results
This example shows the 2011 and 2012 population and median household incomes for zip codes in Las Vegas, NV. ZeeMaps allows you to define your own marker fields, so you can perform this spatial analysis on any of your fields.
At present, you can only spatially aggregate marker data by highlighted colours. In the future, we will be extending this so you can also aggregate data by geographical areas, e.g., get spatial analysis by countries, states, and so forth.
If you’d like to try out the aggregate spatial data by regions feature, you can use this sample map – the zip codes in Las Vegas, NV that we’ve been using as an example in this post. Let us know what you think.
To learn more about aggregating data click here


Great addition to your site ZeeMaps – thanks for always being willing to innovative and improve a product that is already very good!